Profitability-of-Category-Wise-Products
Tools Used
SQL, Tableau, Microsoft Excel.
Data Collection
The data used in this project is based on real scenarios from my previous company. However, the figures have been modified to maintain confidentiality.
Dashboard Overview
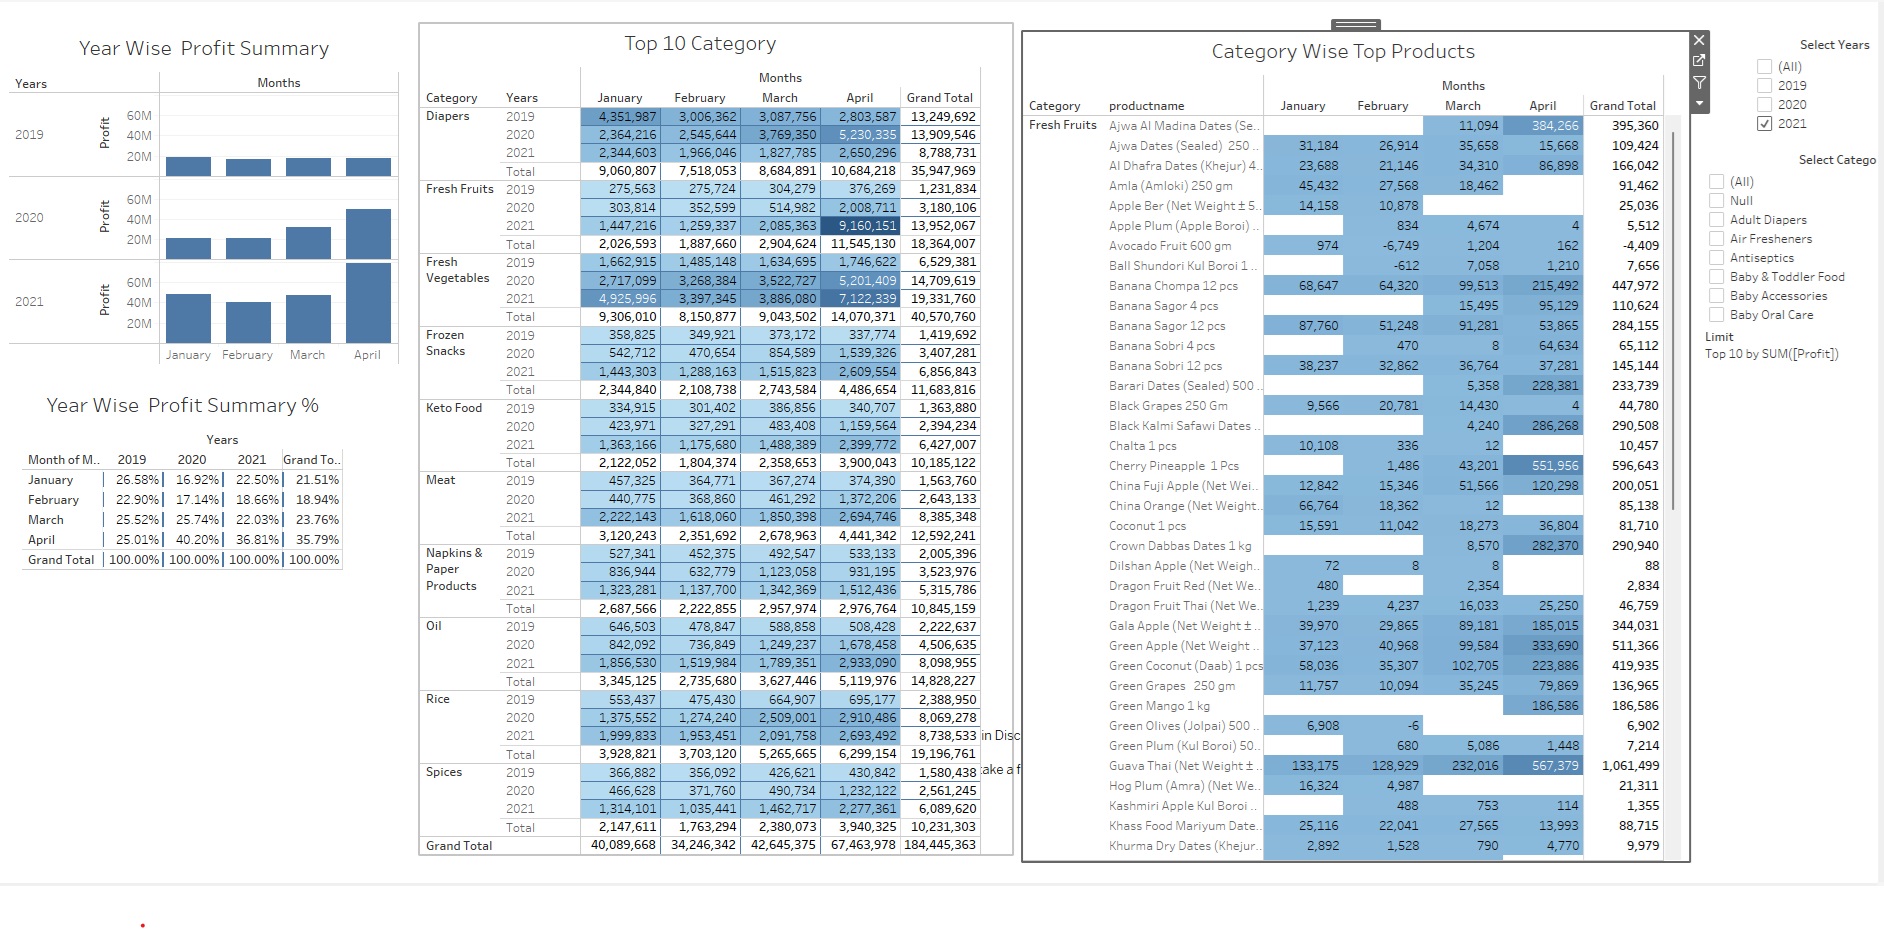
This Tableau dashboard provides insights into year-wise and category-wise profit performance for a e-commerce business. The key sections include:
-
Year-Wise Profit Summary: Displays monthly profit trends over the years 2019, 2020, and 2021. Users can easily compare how profits fluctuated throughout these years.
-
Top 10 Categories: Lists the top 10 product categories based on profit, with monthly breakdowns across the years. It helps in identifying which categories contributed the most to overall profits.
-
Category-Wise Top Products: Drills down into individual products within the top categories, showing their monthly profits data. This section highlights the best-selling products and provides an in-depth view of their contribution to total profit.
-
Filtering Options: Users can filter the data by specific years and categories to customize the analysis to their needs.
This dashboard aids decision-makers in understanding profit distribution across categories and products, enabling better strategic planning for the business.
Dashboard Insights
From the dashboard, several insights can be gathered regarding the business’s performance across different categories, products, and time periods. Below are the key insights:
- Yearly Profit Growth : The profit trends indicate a steady increase in overall profits from 2019 to 2021. Each year’s bar chart shows a rise in profits, with 2021 having the highest profits, particularly in April. This suggests business growth over the years, especially during certain months, which could be due to seasonal trends or successful promotions.
- Top Performing Categories : Diapers, Fresh Fruits, and Frozen Snacks are consistently among the top 10 categories generating the most profit. Diapers show strong and consistent growth across the months from January to April, maintaining high sales and leading to the highest total profits in all three years. Fresh Fruits saw a significant increase in profit, especially in 2021, where April had the largest contribution.
- Seasonality in Sales :A noticeable pattern is seen in certain categories, where profits peak during specific months. For example: Fresh Fruits tend to see a spike in profits around April. Frozen Snacks also saw increased sales in March and April. This seasonality could be linked to consumer demand patterns or external factors like holidays, festivals, or promotions.
- Top Products Driving Profits : Within the Fresh Fruits category, products like Malta, Guava Thai, and Watermelon are the top contributors to profit. Notably, Malta generates a significant amount of profit, peaking in March and April. Guava Thai also performs well, showing steady sales across all months. Specific items like Cherry Pineapple and Pomegranate generate consistent profits but aren’t the top performers compared to the fruits mentioned above.
- Diversification of Profitable Categories : Other categories such as Keto Food, Meat, and Rice also contribute to profits, but at a lower level compared to the top categories. Keto Food experienced substantial growth in 2021, showing an increasing trend in consumer demand for health-related products.
- Percentage Contribution Over the Months : The Year-Wise Profit Summary % reveals that April consistently makes up the largest share of profits across all three years, contributing more than 25% of the total yearly profit. This could indicate that April is a crucial month for business, potentially driven by seasonal demand, promotions, or marketing efforts.
- Impact of New Products: Newer product like Crown Dabbas Dates shows moderate sales but are steadily gaining traction, indicating growth potential for these items.
