Navigating-Customer-Support-Success-A-Metrics-Driven-Approach
Introduction
This report examines key customer support performance metrics over a four-month period, from July to October 2020. The data covers multiple aspects of customer interaction, including live chat conversations, response times, customer feedback, call volumes, and verification times. Analyzing these metrics provides valuable insights into the efficiency and effectiveness of customer support operations, helping identify both strengths and areas needing improvement.
Key Metrics and Observations
1. Live Chat Conversations and Customer Feedbacks
- Trend: Both live chat conversations and customer feedbacks show a declining trend from July to October.
- Insight: This decrease in live chat conversations (779 in July to 565 in October) and customer feedbacks (2361 in July to 1331 in October) may indicate a reduction in customer inquiries and engagement. This could be due to seasonal factors, improved self-service resources, or decreased service demand.
2. Failed Trips Cleared
- Trend: The number of failed trips cleared consistently declined, starting at 390 in July and dropping to 239 by October.
- Insight: This suggests an improvement in operational efficiency, possibly due to better planning or resource allocation. Fewer failed trips indicate enhanced service reliability and fewer incidents requiring recovery.
3. Call Volume (Incoming and Outgoing Calls)
- Trend: Both incoming and outgoing calls declined significantly from July to September, with a slight increase in October.
- Insight: The decline may align with the reduction in customer interactions, as seen in chat conversations and feedback. However, the slight increase in October could reflect a seasonal demand surge or changes in customer support policies.
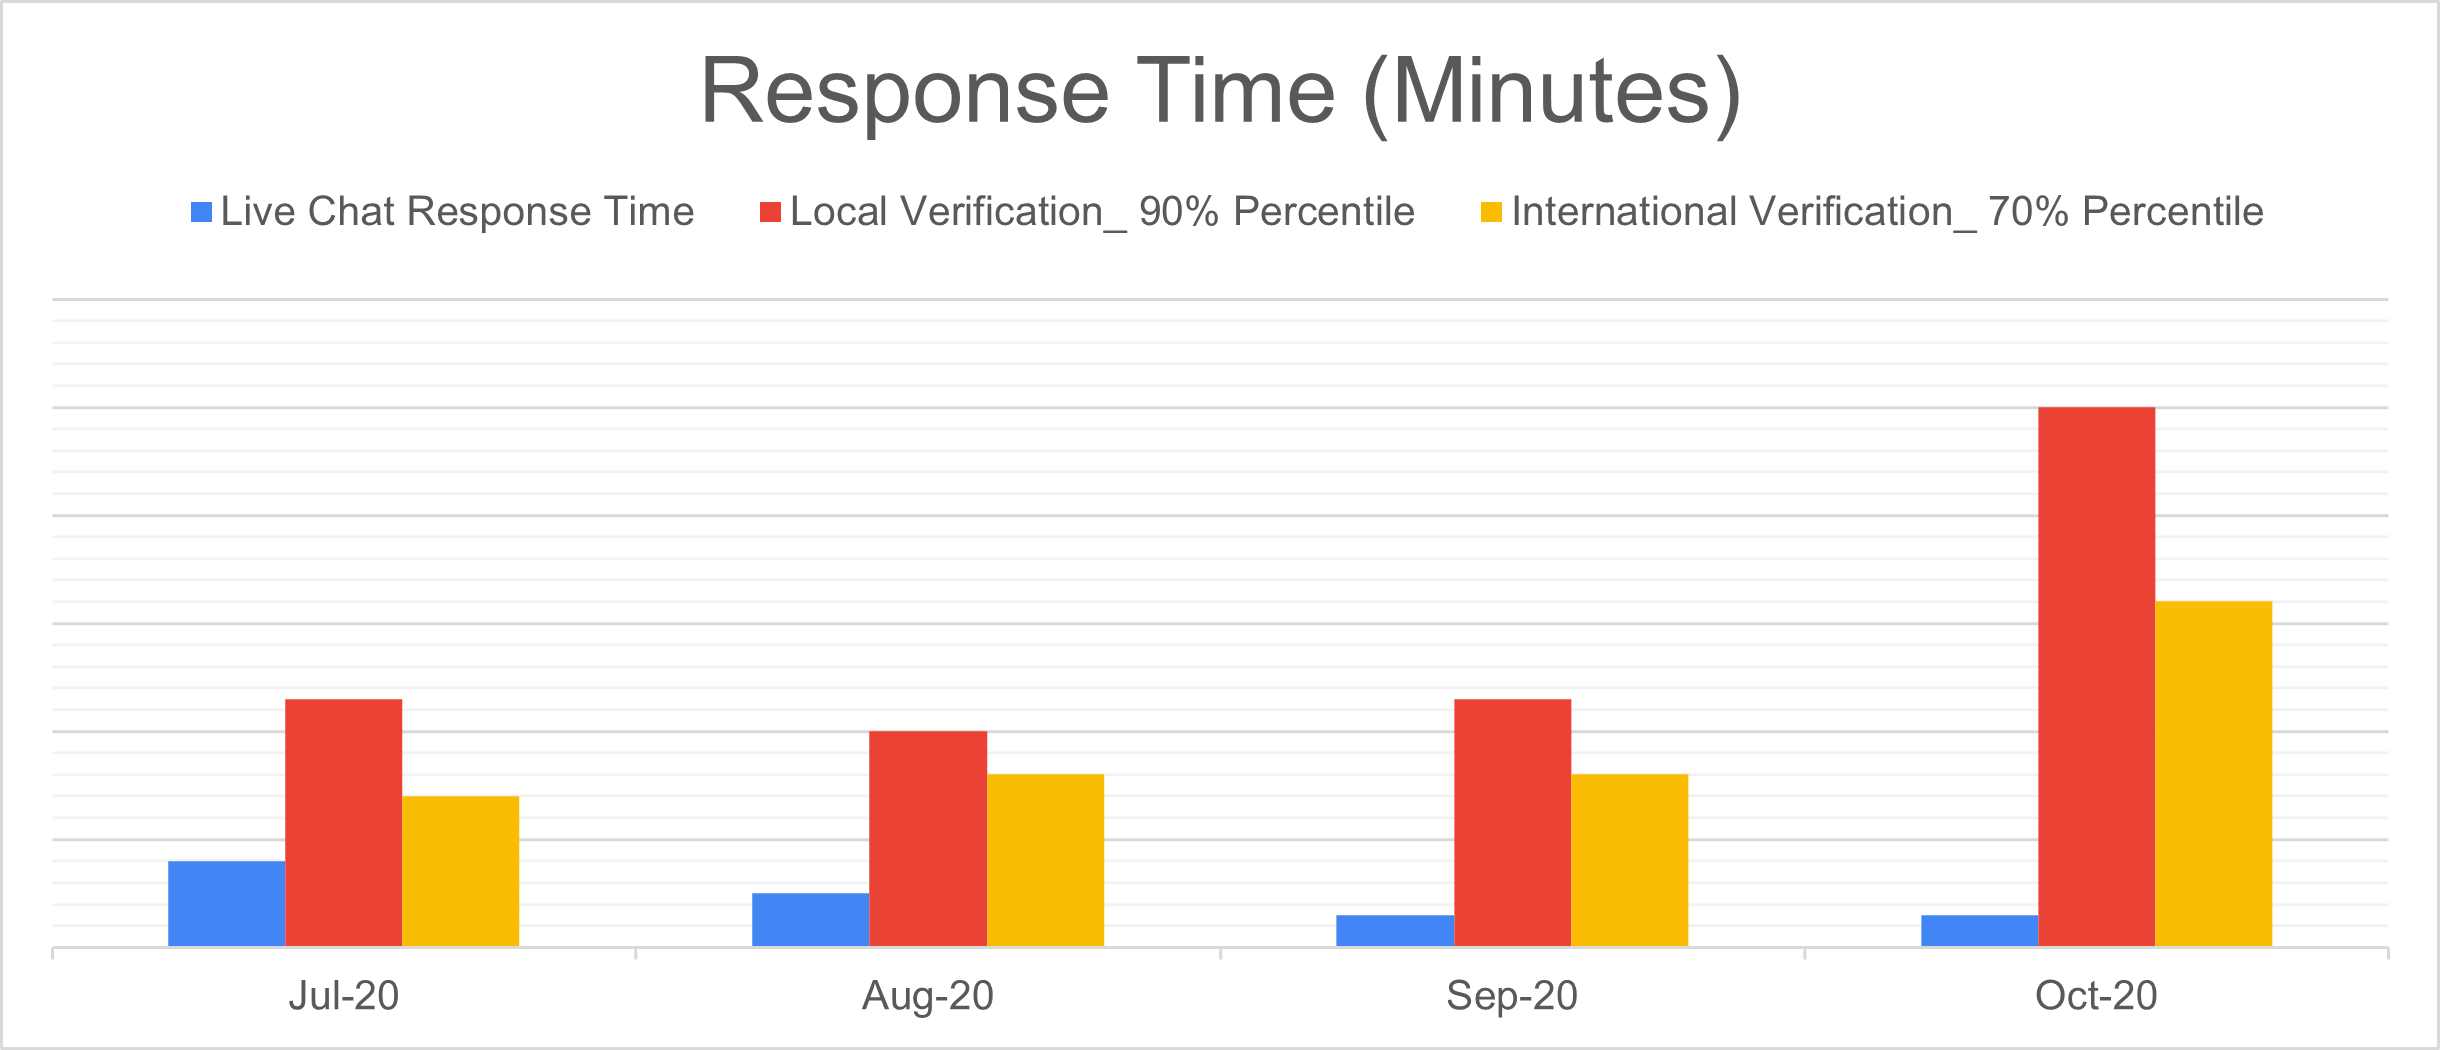
4. Live Chat Response Time
- Trend: The response time dropped significantly, from 8 minutes in July to 3 minutes in September and October.
- Insight: Faster response times demonstrate an improvement in support efficiency. Reduced wait times likely improve customer satisfaction and support experience.
5. Local and International Verification Percentiles
- Local Verification (90% Percentile): While fairly stable from July to September, there was a notable jump from 23 minutes to 50 minutes in October.
- International Verification (70% Percentile): The verification time remained mostly stable through July to September but doubled from 16 minutes to 32 minutes in October.
- Insight: The sharp increase in verification times in October indicates potential process bottlenecks or an increase in demand for verification services. This may require investigation to avoid negative impacts on customer experience.
Conclusion
Overall, the analysis reveals a positive trend in response times and a reduction in failed trips, indicating improvements in support efficiency and reliability. However, the substantial increase in verification times in October may point to new challenges, such as process inefficiencies or a spike in verification demand. Addressing this verification bottleneck will be crucial for maintaining a smooth and satisfactory customer support experience. This report provides a foundation for targeted actions to further optimize support processes and enhance customer satisfaction.